LIMRA Study Shows Life Combination Products in Double-Digit Growth Pattern
Article from Insurance and Finance Newsletter No.14-Catherine Ho examines the history and characteristics of the five years of double-digit, year-over-year growth of life combination products.

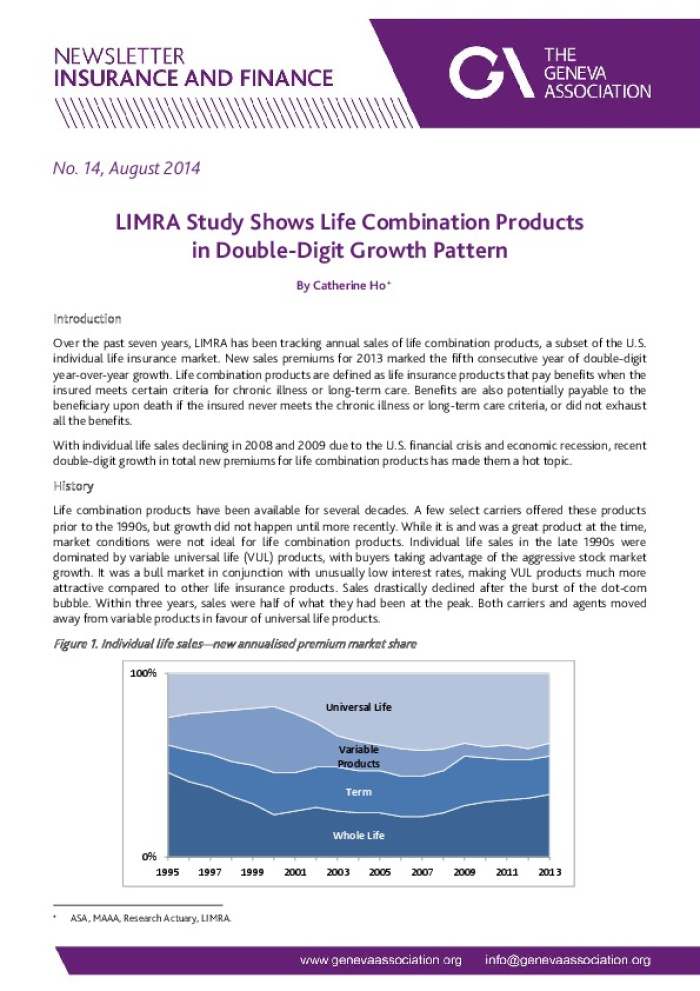
No. 14 , August 2014 LIMRA Study Shows Life Combination Products in Double-Digit Growth Pattern By Catherine Ho+ Introduction Over the past seven years, LIMRA has been tracking annual sales of life combination products, a subset of the U.S. individual life insurance market. New sales premiums for 2013 marked the fifth consecutive year of double -digit year -over -year growth. Life c ombination products are defined as life insurance products that pay benefits when the insured meets certain criteria for chronic illness or long -term care. Benefits are also potentially payable to the beneficiary upon death if the insured never meets the c hronic illness or long-term care criteria, or did not exhaust all the benefits. With individual life sales declining in 2008 and 2009 due to the U.S. financial crisis and economic recession, recent double -digit growth in total new premiums for life combin ation products has made them a hot topic. History Life combination products have been available for several decades. A few select carriers offered these products prior to the 1990s, but growth did not happen until more recently. While it is and was a grea t product at the time, market conditions were not ideal for life combination products. Individual life sales in the late 1990s were dominated by variable universal life (VUL) products, with buyers taking advantage of the aggressive stock market growth. It was a bull market in conjunction with unusually low interest rates, making VUL products much more attractive compared to other life insurance products. Sales drastically declined after the burst of the dot -com bubble. Within three years, sales were half of what they had been at the peak. Both carriers and agents moved away from variable products in favour of universal life products. Figure 1. Individual life sales?new annualised premium market share + ASA, MAAA, Research Actuary, LIMRA. Whole Life Term Variable Products Universal Life 0% 100% 1995 199719992001200320052007200920112013